Welcome to YakCharts.
Turn your data into clear, shareable charts.
Build a chart in seconds and embed it anywhere as an image.
From the web editor, a Slack command, or a single API call.

Every Chart Type
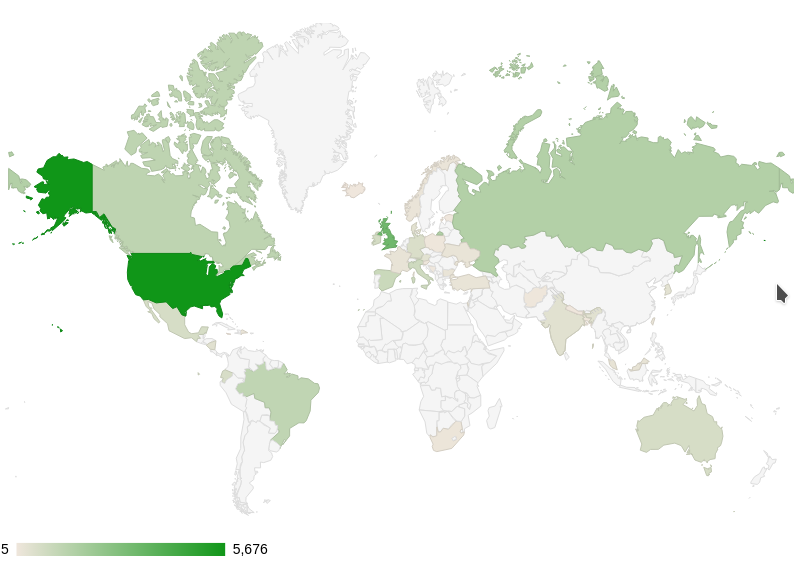
Line, spline, area, bar, stacked bar, pie, donut, scatter, bubble, candlestick, word cloud, Sankey, choropleth maps, and QR codes.
Built-in Themes
Nine ready-made themes — default, dark, light, cerulean, icy, sand, NCS, contrast, and JetBrains — or design your own.
Charts as Images
Every chart renders to a PNG you can drop straight into dashboards, reports, emails, wikis, or anywhere an image works.
Right Inside Slack
Run /yakchart in any channel to post a chart, or open the interactive builder to pick a type, theme, and data.
Visual Editor
Build and fine-tune charts in the browser — data, series, colours, legends, and labels — with no code required.
Simple, Secure API
One authenticated URL returns a finished chart image. Lock requests to your API key, with optional HMAC signing.
Simple Integration
to make your life easier.
We know it's a pain when you have to download a library and read a textbook-sized manual just to use an API. So we made ours simple.
https://yakimagecharts.com/api/chart.png?apiKey=API_KEY&type=line&title=Revenue&data=[[1,10],[2,15],[3,12]]
<!-- Embed a live chart anywhere an image works -->
<img src="https://yakimagecharts.com/api/chart.png
   ?apiKey=API_KEY
   &type=bar
   &title=Quarterly Revenue
   &data=[["Q1",10],["Q2",15],["Q3",12],["Q4",20]]"
     alt="Quarterly Revenue" />
A Finished Image
ready to embed.
The API returns a rendered PNG, so a plain image tag is all you need — no client-side charting library and no JavaScript. It just works in emails, PDFs, and dashboards.
See for Yourself
Clean, professional charts in any theme.
Pick a chart type, paste your data, choose a theme, and export. Adjust colours, legends, and labels to match your brand.
Plus a 30 day free trial, with no strings attached.
100,000 API Requests / Month
SSL Encryption
1,500,000 API Requests / Month
SSL Encryption
Currency
Language
5,000,000 API Requests / Month
SSL Encryption
Currency
Language
